Risk and Odds
Input type:
|
|||||||||||||||||||||||||||||||||||||||||||||||||||
Explanations & examples: If you already have the data prepared for entering into the 2 × 2 table (if you know the values to enter into the cells) then you should leave the option "Input type" on
its default value "2 × 2 table". Otherwise, if you have the original, raw data as lists in a text file, like this;
If you already have the data prepared for entering into the 2 × 2 table (if you know the values to enter into the cells) then you should leave the option "Input type" on
its default value "2 × 2 table". Otherwise, if you have the original, raw data as lists in a text file, like this;
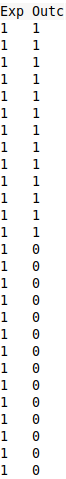
then you should choose option "raw data" and then copy/paste the data into the table and click on calculate. Having chosen "raw data" you can also click the radio buttons to choose whether the data in your text file is in colums (like in the picture above) or in rows, like this: 
When data is in this form as "raw data" then only two values are valid for both exposure and outcome, namely 0 and 1. The value 1 for the variable "exposure" meaning that the individual was exposed, the value 0 that the individual wasn't exposed. The value 1 for "outcome" means that the individual got the outcome, the value 0 that the individual didn't get the outcome. Each individual/patient then has two values, one for exposed and one for outcome with four possible combinations; [1 1], [1 0], [0 1] and [0 0]. When comparing two risk groups with each other through risk, odds, risk ratio and odds ratio, we have the exposed group in the first row of the 2 × 2 table and the unexposed group in the second row below. Persons in the exposed group have experienced the exposure and the persons in the unexposed group haven't. In the left column of the 2 × 2 table are all the people who later got the outcome (disease) and in the right column those who didn't. In other words, the data should be entered into the table like this:
The calculated results are the risks and the odds of getting the outcome for both the exposed as well as the unexposed group. When comparing the two groups (too see whether being exposed has a significant effect on the outcome compared with not being exposed) different concepts can be used, for eg. risk difference (the risk of the exposed group minus the risk of the unexposed group), risk ratio (the risk of the exposed group divided by the risk of the unexposed group), odds ratio (the odds of the exposed group divided by the odds of the unexposed group) and a chi-squared-test to see whether the deviation between the observed data and the expected data (i.e. what the observed data would have been if there had been no difference between exposed and unexposed) is statistically significant. If risk difference is used as a measure for testing a significant association between exposure and outcome, then the p-value of the test should be below 0.05 to reject the null hypothesis (H0) which claims that the risk difference = 0 (that there is no significant difference between the risks of the exposed and unexposed group). In other words: If p is below 0.05 then there IS a significant difference between the risks of the two groups on a 5 percent significance level, meaning that exposure has in fact had an effect on the outcome. In this case, the 95% confidence interval of the risk difference will not contain the number 0 (because then the risk difference can't be zero with 95% certainty). If risk ratio (the relative risk) is used to test whether there's a significant association between exposure and outcome, then the p-value should be below 0.05 to reject the null hypothesis H0. The null hypothesis says that risk ratio = 1 i.e. the exposed group has no significantly higher risk of getting the outcome compared to the non-exposed group. In this case (p below 0.05) the 95% confidence interval of the risk ratio will not include the number 1 (because H0 was rejected claiming that RR = 1). The meaning of the number RR is that the exposed group has a that many times higher risk of getting the outcome compared with the unexposed group. If odds ratio (the ratio between the two odds) is used as the mean of comparison and test, then the p-value should also here be below 0.05 to say there is a significantly different odds in the two groups, for then we can reject the null hypothesis H0 that claims OR = 1 (i.e. there's no difference). If we can not reject that OR could be 1 (if p > 0.05), then we can not reject that there's no significant difference between the odds of getting the outcome in the exposed and unexposed group. Meaning that there can't be established an association between exposure and outcome. In the chi-squared-test it is tested whether the deviations between the actual, observed numbers and the expected numbers (which would have been observed had it been true that exposure had no significant effect on the outcome) are so large that we have to reject the null hypothesis. The null hypothesis H0 claims that there's no significant difference between the observed and the expected values. In other words that there's no statistically significant association between being exposed and getting the outcome. If the p-value in the chi-squared-test is under 0.05 then we can reject that the deviations could occur by coincidence, under the assumption that H0 is true. For then it would be extreme unlikely (under 5%) to observe that big differences between observed and expected values under the assumption that there shouldn't be any differences at all (since it was assumed that H0 was true). So if P < 0.05 then there is a statistically significant effect of the exposure on the outcome compared with non-exposure on a 5 percent significance level. For more infos and formulas about the risk, odds, risk ratio, odds ratio, ... etc., please see the page formulas. Example:In a study of 13153 people, 1518 suffered from hypertension. This is the exposed group. Of these 1518, 43 had had the outcome (a stroke) at the end of the study. The non-exposed group consisted of 11635 persons who didn't have hypertension. Of these 11635 persons 69 suffered a stroke during the time of the study. We want to find out whether there's a significant association between having hypertension (high blood pressure) and getting a stroke.
The calculated risk ratio is RR = 4.78, meaning that the exposed group (hypertension) has a 4.78 times higher risk of getting a stroke compared with the non-exposed group. This can also be formulated as that the exposed group has a (4.78 - 1) × 100 = 378 percent higher risk of getting the outcome (stroke) compared with not having been suffering from hypertension. In this case the exposure seems to be a worsening factor rather than an improving factor in the risk of getting the outcome (because the value of RR is more than 1). To test whether the association between hypertension and stroke is significant on a 5% significance level, the z-test is being performed testing the null hypothesis H0: RR = 1. The z-value is 8.1290 and the p-value is 0.0000, which is far below 0.05. Therefore we can reject H0 that claimed that there was no significantly big difference between the risks of the exposed and unexposed groups. Therefore there IS a statistically significant difference between the risks of the exposed and non-exposed groups, i.e. it has a significant effect on the risk of getting a stroke to have been suffering from hypertension. This is confirmed by the 95% confidence interval of RR [3.28 : 6.96], which does not contain 1. |
|
||||||||||||||||||||||||||||||||||||||||||||||||||