Tables
Decimals:
|
The Standard Normal Distribution: \( N(0,1) \) The z-value and the p-value to be entered in the table below are defined to satisfy the following:$$ p = 2 \ \cdot P(Z > |z|) = 2 \ \cdot \int_{|z|}^{\infty} \phi(z) \: dz $$Where \( \phi(z) \) is the standard normal distribution with mean 0 and standard deviation 1:$$ \phi(z) = \frac{1}{\sqrt{2\pi}} \ \cdot \text{e}^{-\frac{1}{2} z^2} $$In other words: the p-value is two times the area under the bell shaped curve from |z| to infinity. The number |z| is the numerical (positive) value of z. If, for example, the z-value is z = -1.43, then the number to be entered into the table is |z| = |-1.43| = 1.43. And if z = 2.27, then |z| = |2.27| = 2.27.For example:$$ 0.05 = 2 \ \cdot 0.025 = 2 \ \cdot P(Z > |1.96|) = 2 \ \cdot \int_{1.96}^{\infty} \phi(z) \: dz $$The p-value is the two-sided (or two-tailed) area under the bell curve; one area from each "tail". The two areas are the same, since the function is symmetric. If you only need (or only have) half of the p-value, the table can still be used; just enter the |z| value and get the p and ½p values. Or enter either p or ½p to get the other two values.
The Normal Distribution: \( X \text{~} N(μ , σ) \) If you have a general normal distribution with mean μ and standard deviation σ, and need the area under the bell shaped curve from x1 to x2 then the p value is defined as follows:$$ p = P(x_1 < X < x_2) = P(X < x_2) - P(X < x_1) = \int_{x_1}^{x_2} f(x) \: dx $$Where \( f(x) \) is (in this case) the normal distribution with mean μ and standard deviation σ :$$ f(x) = \frac{1}{\sqrt{2\pi \sigma^2}} \ \cdot \text{e}^{-\frac{(x - \mu)^2}{2 \sigma^2}} $$If you need the lower bound to be minus infinity ( \(-\infty\) ) or the upper bound to be infinity (\( \infty \)), in other words if you need one of the following areas;$$ p = \int_{-\infty}^{x_2} f(x) \: dx \:\: \color{blue}{\text{or}} \:\: \color{black}{p = \int_{x_1}^{\infty} f(x) \: dx} $$then you can type either "-INF" as the x1 value or "INF" as the x2 value.
|
||||||||||||||||||||||||||||||||||||||||||||||||||||||||||||||||||||||||||||||||||||||||||||||||||||||||||||||||||||||||||||||||||||
|
The F Distribution An f-test is performed to test whether the variances of two samples can be assumed equal. In other words whether the null hypothesis is rejected or not rejected. The null hypothesis states that H0: Var1 = Var2 , where Var1 = (SD1)2 is the variance of the first sample and Var2 = (SD2)2 is the variance of the second sample. Consequently, \( SD_1 = \sqrt{Var_1} = \sqrt{(SD_1)^2}\) is the standard deviation of the first sample. And \( SD_2 = \sqrt{Var_2} = \sqrt{(SD_2)^2}\) is the standard deviation of the second sample involved in the f-test. Another way of stating the H0 hypothesis is that the ratio of the variances is 1:$$ H_0 : \frac{(SD_1)^2}{(SD_2)^2} = 1 \:\: \text{(or)} \:\: H_0 : \frac{(SD_2)^2}{(SD_1)^2} = 1 $$The f1-value, the f2 value and the corresponding p1 and p2 values are defined as follows:$$ f_1 = \frac{(SD_1)^2}{(SD_2)^2} , f_2 = \frac{(SD_2)^2}{(SD_1)^2} = \frac{1}{f_1} $$The number p1 is the smallest of the two following numbers:$$ p = \int_{f_1}^\infty{f(x)} \: dx \: \: \: \: \: \: \text{and} \:\:\:\:\:\: 1-p $$The number p2 is the smallest of the two following numbers:$$ p = \int_{f_2}^\infty f(x) \: dx \:\:\:\:\:\: \text{and} \:\:\:\:\:\: 1-p $$The overall p-value in an F-test, taking into consideration both f1 and f2, is therefore the following number:$$ p_{total} = p_1 + p_2 $$The f-test starts by assuming that H0 is in fact true, namely that Var1 = Var2. The overall p-value ptotal
(a number between 0 and 1) is the probability of getting as big a deviation from the hypothetical f-value of 1, or an even bigger deviation, as the one being observed.
For the start assumption was that H0 is true; meaning that both f-values should be equal to 1, or at least close to 1, in correspondance with the assumption.
The function \( f(x) \) is the probability density function of the F-distribution defined as:$$ f(x) = \frac{df_1^{\frac{df_1}{2}} \cdot df_2 ^\frac{df_2}{2} \cdot \Gamma\left(\frac{df_1 + df_2}{2}\right) \cdot x^{\frac{df_1}{2}-1}}{\Gamma\left(\frac{df_1}{2}\right) \cdot \Gamma\left(\frac{df_2}{2}\right) \cdot \left(df_2 + df_1 \cdot x\right)^{\frac{df_1 + df_2}{2}}} , $$where DF1 = N1 - 1 is the degree of freedom of the first sample and DF2 = N2 - 1 is the degree of freedom of the second sample. For more details, go to page "Formulas" in the menu.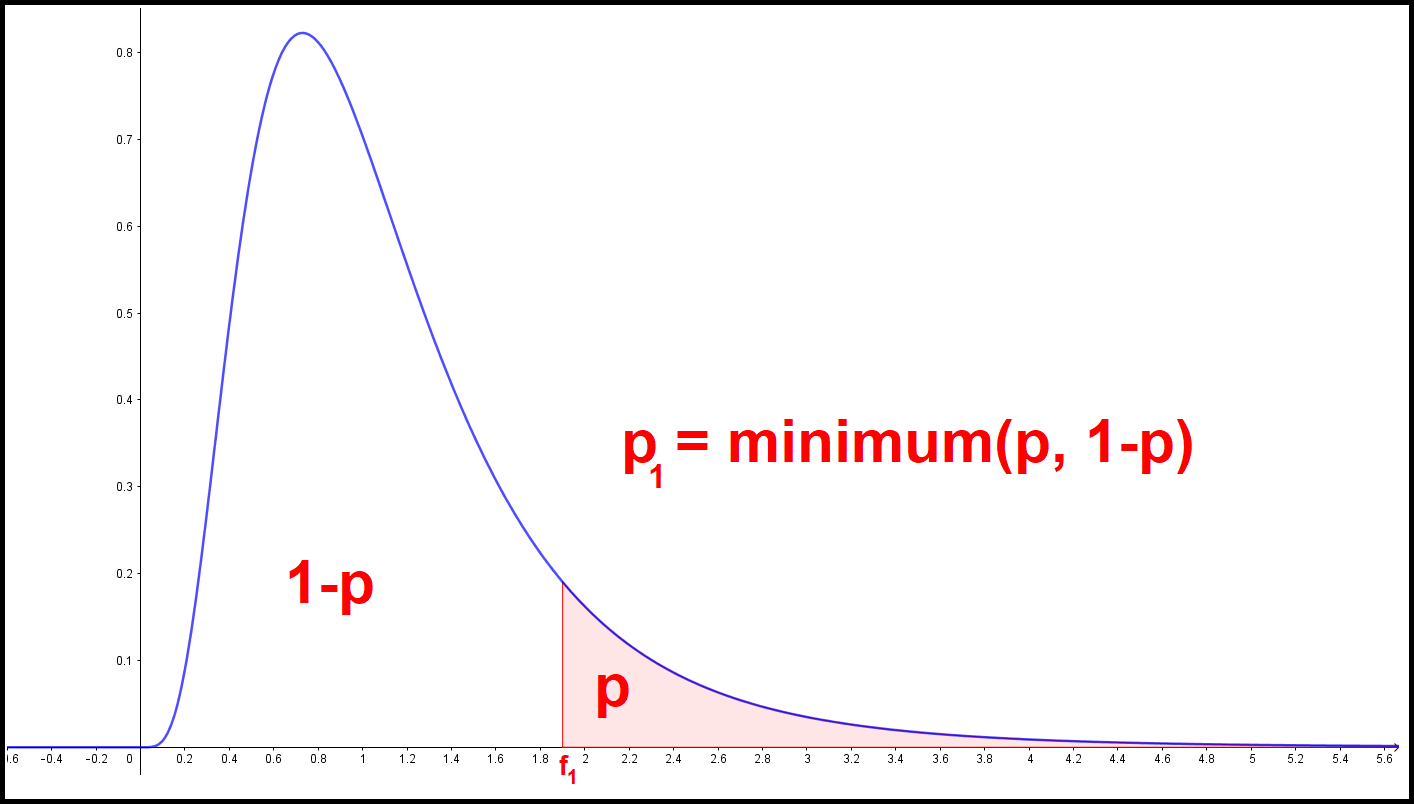
|
||||||||||||||||||||||||||||||||||||||||||||||||||||||||||||||||||||||||||||||||||||||||||||||||||||||||||||||||||||||||||||||||||||
| F-distribution table in the case of known standard deviations | ||||||||
|---|---|---|---|---|---|---|---|---|
| SD1 | SD2 | DF1 | DF2 | f1 | f2 | p1 | p2 | ptotal |
Use the following table if you have the variances Var1 = (SD1)2 and
Var2 = (SD2)2 from the two samples:
| F-distribution table in the case of known variances | ||||||||
|---|---|---|---|---|---|---|---|---|
| (SD1)2 | (SD2)2 | DF1 | DF2 | f1 | f2 | p1 | p2 | ptotal |
*****************************************************************************************************************************
If you only need to find a specific p-value corresponding to a particular f-value (or the other way around), in other words an f and a p value satisfying that
$$ p = P(X > f) = \int_{f}^\infty{f(x)} \: dx , $$you can then instead use the table below over f-distribution values given DF1 and DF2 and either p or f:
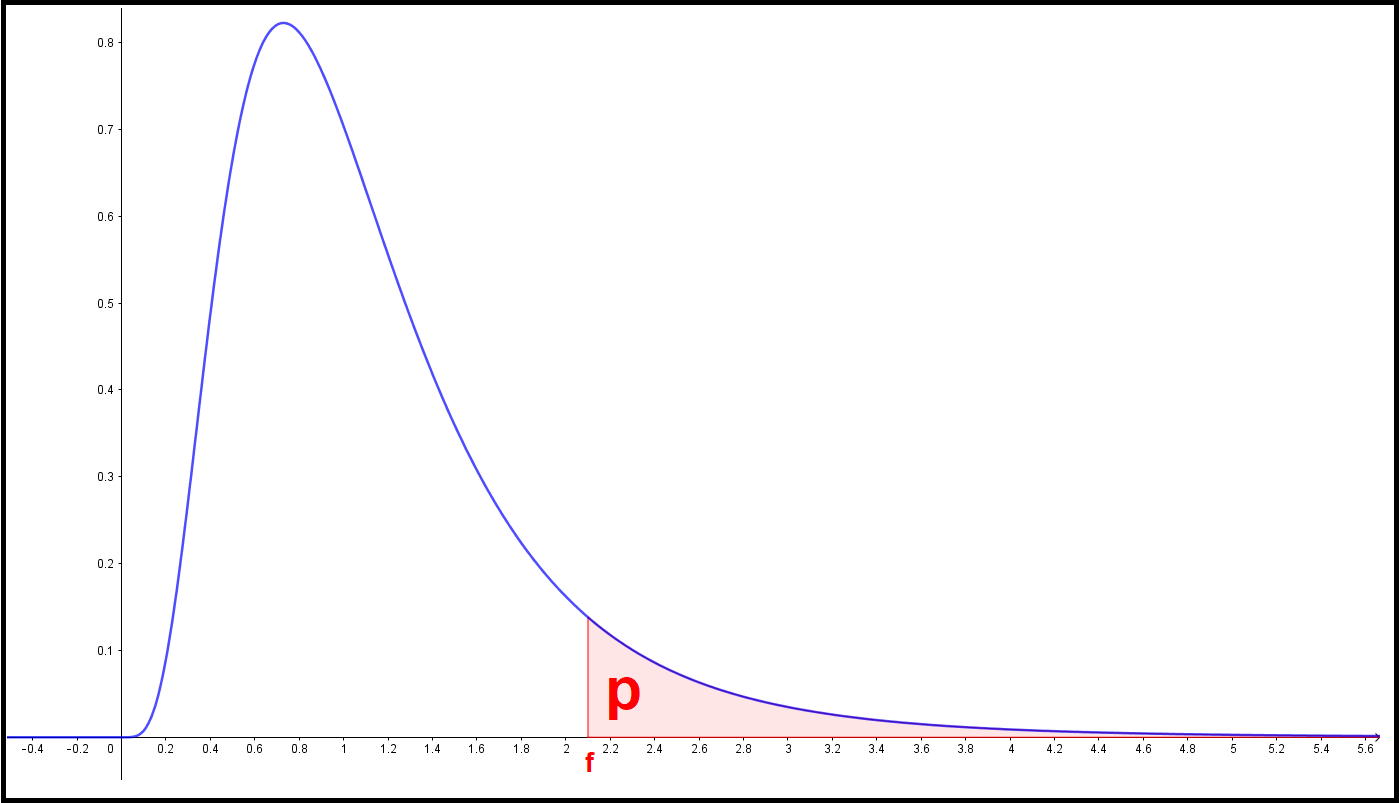
| F-distribution table | |||
|---|---|---|---|
| DF1 | DF2 | f | p |
The T-Distribution
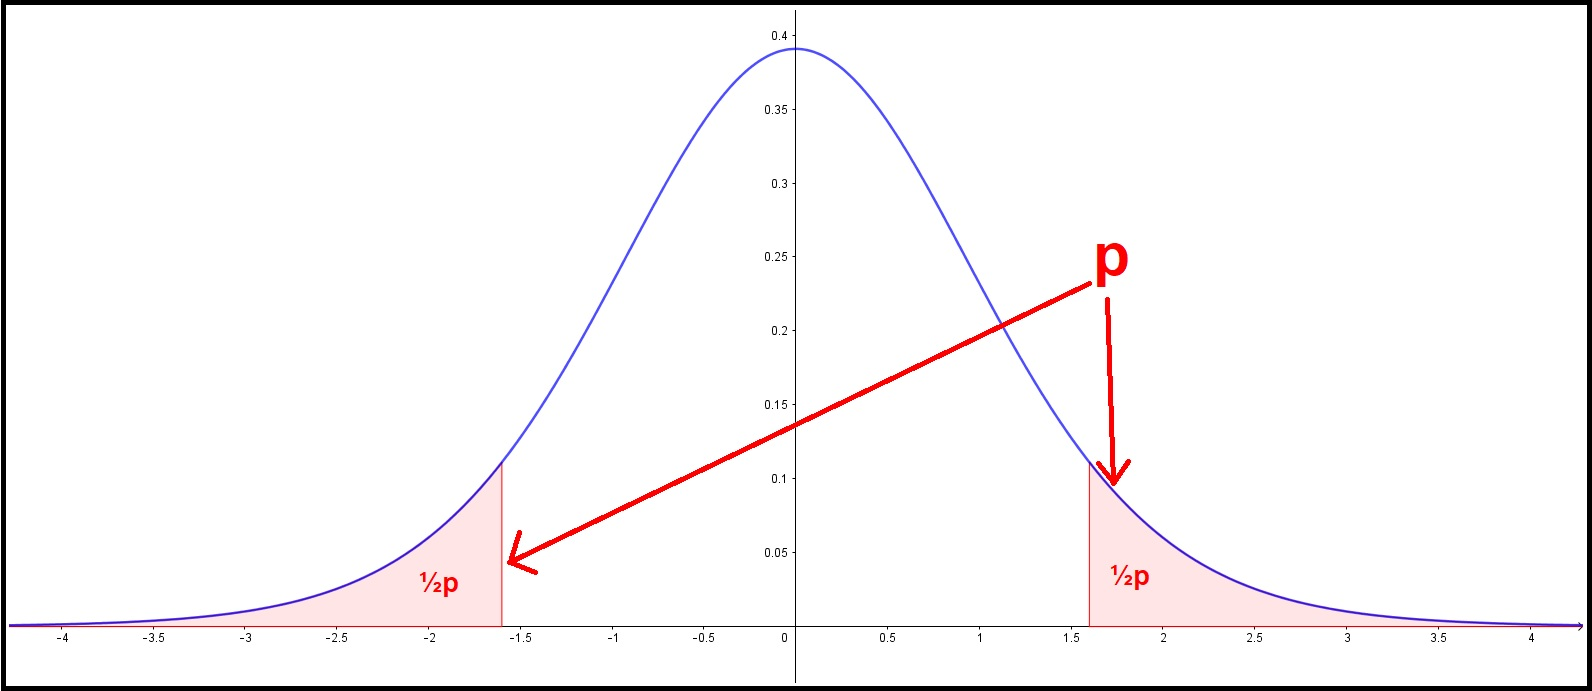
The |t|-value, the DF-number and the corresponding p-value are defined as follows:
$$ p = 2 \ \cdot P(T > |t|) = 2 \ \cdot \int_{|t|}^{\infty} f(x) \: dx , $$where \( f(x) \) is the probability density function of the T-distribution with DF degrees of freedom:
$$ f(x) = \frac{\Gamma{\left( \frac{df+1}{2}\right)}}{\sqrt{\pi \cdot df} \cdot \Gamma{\left(\frac{df}{2}\right)} \cdot \left( 1 + \frac{x^2}{df}\right)^{(df+1)/2}} $$|t| is the numerical (positive) value of the t-value.
You can input either the two-sided (two-tailed) p-value in order to get the |t| value and the one-sided ½p value. Or you can input the one-sided ½p value
and get the |t| value and the p-value. Or input the |t| value and get p as well as ½p.
For more details, go to the page "Formulas" in the menu.
| T-distribution table | |||
|---|---|---|---|
| t-value | DF | p (two-sided) | \( \frac{1}{2} \) p (one-sided) |
*****************************************************************************************************************************
If you are looking for the areal under the bell curve of the probability density function of the T-Distribution between two t-values t1 and t2, you can use the table below instead:
The p-value will then be the integral:
$$ p = P(t_1 < T < t_2) = \int_{t_1}^{t_2} f(x) \: dx , $$where \( f(x) \) is the probability density function of the T-distribution with DF degrees of freedom (see above)
If t1 is \(-\infty\) (minus infinity) you can write "-inf" as input under t1.
If t2 is \(\infty\) (infinity) you can write "inf" as input under t2.
The p-values would then in those cases be:
$$ p = P(-\infty < T < t_2) = \int_{-\infty}^{t_2} f(x) \: dx \:\: \color{blue}{\text{or}} \:\: \color{black}{p = P( t_1 < T < \infty) = \int_{t_1}^{\infty} f(x) \: dx} $$
| T-Distribution table | ||||
|---|---|---|---|---|
| DF | t1 | t2 | p-value | |
The Chi-Square-Distribution (\(\chi^2\))
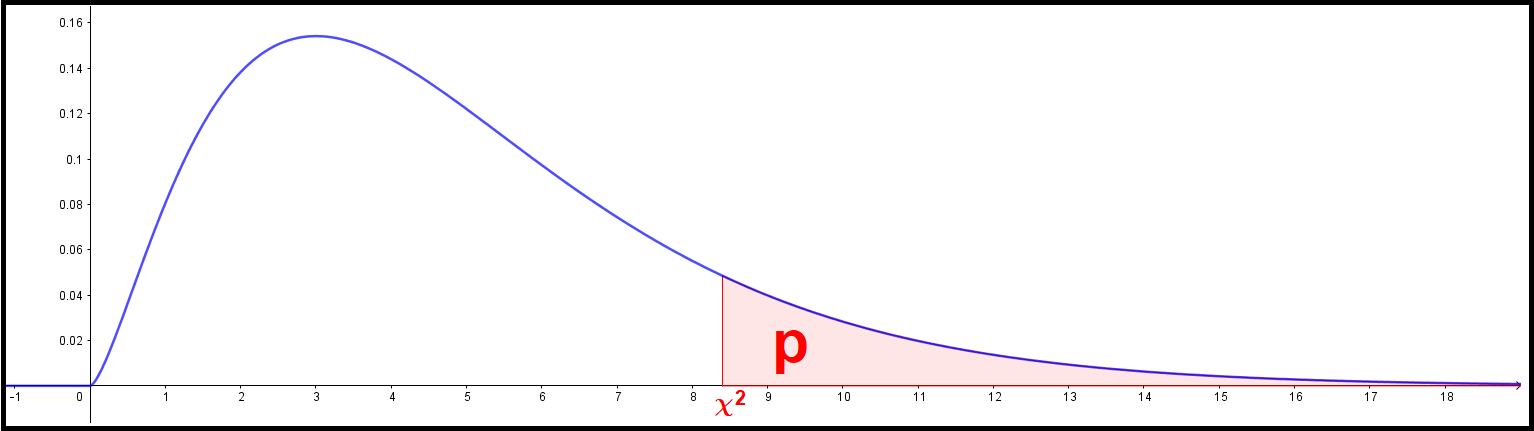
The χ2 - value, the DF-number and the corresponding p-value are defined as follows:
$$ p = P(X > \chi^2) = \int_{ \chi^2 }^{\infty} f(x) \: dx , $$where \( f(x) \) is the probability density function of the chi-square-distribution with DF degrees of freedom:
$$ f(x) = \frac{x^{\frac{1}{2} \cdot df - 1} \cdot \text{e}^{-\frac{1}{2} \cdot x}}{2^{\frac{1}{2} \cdot df} \cdot \Gamma\left( \frac{df}{2}\right)} $$In other words the p-value is the area under the curve from χ2 to infinity. For more details, go to the page "Formulas" in the menu.
| Chi-Square-Distribution table | ||
|---|---|---|
| \( \chi^2 \) value | DF | p-value |