Version 1
for small sample sizes (N ≤ 20)
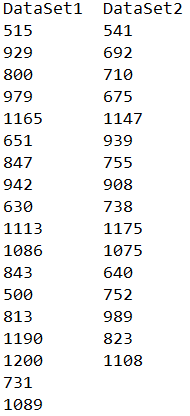
Explanations & examples: If the data in your text file looks like this:
 Then you should choose the option "data in file is in columns" to the right when copy/pasting or uploading. If, on the other hand, the data in your text file looks like this:  Then you should choose the option "data in file is in rows" to the right when copy/pasting or uploading. In a Mann-Whitney (Wilcoxon) U Test two data sets are tested for equality (whether they could be assumed to be distributed identically). The two data sets involved in a Mann-Whitney U test cannot be assumed normally distributed, for if they had been normally distributed, a parametric test would have been used instead like a z-test or a t-test where the mean and the standard deviation of the data sets are input as parameters during the test. A Mann-Whitney U Test is therefore a non-parametric test where the mean values and standard deviations of the data sets don't have to be calculated beforehand. Instead the Mann-Whitney U Test is based on the ranks of the observations in each group. The rank of each value in the two data sets is calculated as follows: All the numbers from both data sets are sorted in ascending order in one list. The first (lowest) number in the list has rank 1, no matter what data set it belongs to. The next number has rank 2 ... etc. If there are more than one number with the same value, an average rank is given to all the numbers with that same value. The test statistic U is then calculated in the following way: For smaller sample sizes (N < 20): Use the section "Version 1" For each number (observation) in data set 1 it's counted how many numbers in data set 2 that it is larger than (has a higher rank than). If it's equal to a number in data set 2 it counts as ½. For each number in data set 1 we then get a sum of its "victories" and ties over all the numbers in data set 2. By adding together all these "sums of victories" for all the numbers in data set 1 we obtain the number U1. The number U2 is obtained conversely by counting for each single number in data set 2 its victories over and ties with all the numbers in data set 1. The test statistic U is the smallest of the two numbers U1 and U2. The obtained U value is then compared with the critical U value in the table over critical U values. If the obtained U value is smaller than the critical table value of U the null hypothesis H0 is rejected. For if the value of U is small, that means that there is one of the data sets in which there are not very many of the numbers that are larger than the numbers in the other data set. Therefore it is very unlikely that the two data sets could be assumed to have the same distribution, and therefore the p-value is small (p < 0.05 or p < 0.01 depending on the significance level) and we reject the null hypothesis claiming that the data sets could be equally distributed. So this is a big difference from and the complete opposite of for eg. a z-test where the p-values will become smaller for larger values of z.   For larger sample sizes (N > 20): Use the section "Version 2" The two U-values U1 and U2 are calculated as follows: $$ U_1 = R_1 - \frac{n_1(n_1 + 1)}{2} \text{ and } U_2 = R_2 - \frac{n_2(n_2 + 1)}{2} $$ Here, n1 is the sample size (no. of values) in data set 1 and R1 is the sum of the ranks of the values in data set 1. Same for n2 and R2 just for data set 2 instead. For large sample sizes, U is approximately normally distributed, so the z-value can be calculated as: $$ z = \frac{U - m_U}{\sigma_U} , $$ where mU is the mean value of U and σU is the standard deviation of U. For more infos and formulas, please see under page formulas. |
No. of rows: |
|
||||||||||||||||||||||||||||||||||||||||||||||||
|
||||||||||||||||||||||||||||||||||||||||||||||||||